From ALV to List Report (Features)
You want to switch from a report with ALV to a RAP object with a list report? Where exactly do you find the different functions and features in the UI? Let's take a detailed look at the comparison.

Table of contents
In this article, we will look in detail at which functions are available in the list and where to find them.
Introduction
One of the most important functions when working with data is the ability to use various settings to show or hide columns, calculate totals, define groups or other filters, or search the list. Therefore, it definitely makes sense to look at the various functions available in the table and compare whether all functions are present or if compromises have to be made.
Function Bar
The function bar is a central component, as it makes all functions available to the user in a simple and visually appealing way. In most cases, this bar is located directly above the data.
SAP GUI
In the classic world, there are two places where the function bar can appear: Depending on how the ALV is integrated, it can either be located directly above the list or in the pushbutton bar, where other buttons are found. In this example, it's directly above the list because we've also integrated a custom action via the SALV. This is a custom button with its own action when executed. The bar also contains various ways to interact with the data.

Fiori App
In this example, the bar is also located above the output table. However, it's not on the left, but on the right above it. The actions are also much more manageable, as most are hidden behind context menus or other navigation. This makes the bar not quite as overwhelming as in the classic world.

Search
If you want to search in the classic list, you can do this using the two different icons, Ctrl + F, or the column's context menu. Numerous search functions are available for searching within the data. The search usually remains exact.

In the Fiori world, there is a simple field for this, which is displayed as soon as the search function within the Core Data Service has been activated. The search does not cover the entire table, but allows you to search the configured columns. One advantage of searching in the Fiori world is that we can use fuzzy search, essentially performing fault-tolerant and imprecise searches to obtain more hits when we don't know the exact value or input.

To display the field in the filter bar, the first step is to activate search in the Core Data Service. This is done at the header level. The second step is to define all fields that can be searched as searchable elements. Here, it's also possible to define the fuzziness.
@Search.searchable: true
define root view entity ZBS_C_DemoListReport
...
{
      @Search.defaultSearchElement: true
  key KeyValue,
Export
ALV is particularly popular for its flexible data export capabilities. Standard formats include Word files, Excel files, unstructured files, email, and HTML download. This comprehensive data export option allows for further work without having to manually send the information.
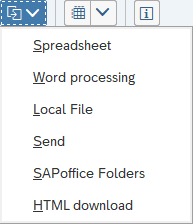
In the new environment, you'll also find the export button in the toolbar. Here, you can choose to export as an Excel file or as a PDF. Further export options are not available, which isn't necessarily a problem since Excel files are most commonly used.

Data Preparation
In this section, let's look at working with the actual data. The table is displayed and is usually not static; the user wants to interact with it, move columns, change the sorting, perhaps create groups, or hide columns entirely to see only the necessary information.
SAP GUI
In the function bar, you will find a button to open the more complex settings. Here you have the option to define the different columns that are displayed, show or hide them, change the sorting, set additional filters, and make further adjustments to the ALV. However, we must also mention that, for example, personally set filter settings can repeatedly lead to problems, as the filters are not correctly recognized by the user, and they may therefore not see data that is actually present. The problem here is that there is the selection screen for the filter, but also the option to filter the result again.

Üüber zum Kontextmenü For each column, you also have additional options to hide the field directly, adjust the width, sort it, or search.

However, it becomes a bit more difficult when using groupings. To apply a grouping, you first have to calculate a sum and can then group according to further elements. In this case, we actually only wanted to group the different rows by currency and look at the different groups.

Fiori App
You can also find the settings for displaying the different columns via the gear icon in the function bar. There you can show or hide columns and change their order. Sorting and grouping options are also available. Filters are not available here, as they are set via the filter bar.

Clicking on a column will give you additional options in the context menu. This allows you to quickly adjust the sorting, set up grouping, or optimize the column width.

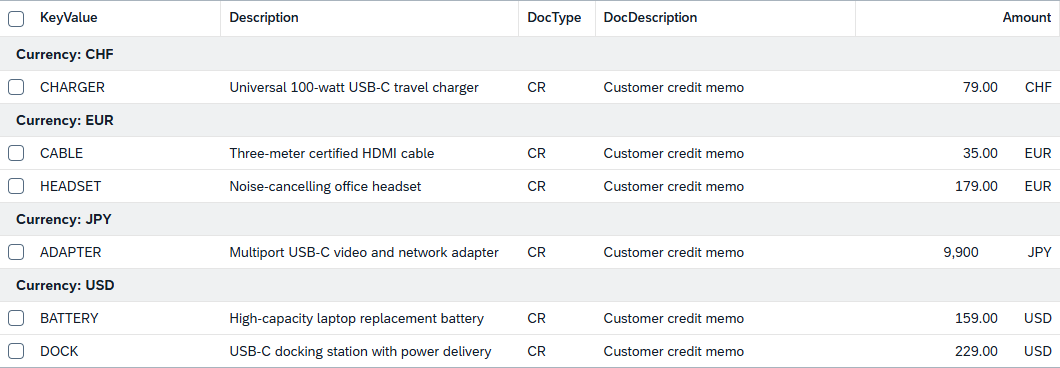
Unlike ALV, creating groups here is relatively easy, because we only need to select the element and can then activate grouping, for example, in the context menu. The result is automatically grouped, as shown below.
Complete Example
In this chapter, you will find all the resources for comparing the two applications. We've placed the RAP object in a new repository so you can clone it. The program is simply a resource also located in this repository. You can use the table and generation class from the repository to generate the data for the report. If you're on the same system, then you only need the table and the class once.
Conclusion
An important aspect after filtering is displaying the different values in an output table and being able to work with this data. In this article, we looked at various options and functions that exist in both systems, but which are presented differently, function differently, or are located in different places.