RAP - Analytical Table
Let's take a look at the last missing piece of the puzzle in RAP to replace the ALV and how we can set up the Analytical Table with minimal effort.

Table of contents
In this article, we'll look at the Analytical Table and how we can use it to achieve some of the missing functionalities of the ALV.
Introduction
The ALV has been the standard tool for ABAP developers, as it allowed them to display all the basic functionalities without requiring much implementation effort. Sorting, grouping, filtering, and Excel export were available as standard features, just like in the classic List Report in Fiori Elements. However, one feature was missing: totals and subtotals, which were also easy to create in the ALV. Today we will extend our Sales App and adjust the table type currently used by the List Report.
Table Type
When we generate the classic List Report, it usually has the same structure. The upper section contains a filter bar to restrict and work with the data in the lower section. The lower section displays a table for the data output, and clicking on an item takes us to the object page, where we get even more information and details.

However, the table in the lower section can be modified using annotations, objects, or during generation to cover different scenarios. Therefore, there are already different types for this area:
- Responsive Table - This type is designed for different screen sizes. Only as much information is displayed as fits on the screen. Excess columns are hidden.
- Grid Table - All columns are displayed, which also have a fixed width. Information that doesn't fit on the current screen can be accessed via a scroll bar. The behavior is similar to an oversized ALV.
- Tree Table - The information is output hierarchically and displayed as a tree in the list (see article).
- Analytical Table - Analytical functions such as totals and subtotals are possible (this article).
Analytical Table
With the latest release 2511, the last missing feature in the ABAP Environment, in the form of the Analytical Table, was delivered. This allows us to activate the totals and subtotals in the output, albeit with certain limitations, as we will see shortly.
Activation
To activate the Analytical Table, we basically only need two annotations in the Projection View ZBS_C_SASale. At the header level, we must first activate aggregation. Various options such as FULL or RESTICTED are available here. Currently, only the #FULL attribute activates the new table.
@OData.applySupportedForAggregation: #FULL
Then we need to activate default aggregation on the respective elements in the Core Data Service. We set the respective mode using the annotation "Aggregation.default". For sales, we set the sum, and for differences, we set the interface value, since we are interested in the average loss per contract or grouping. This completes the actual activation and the switch to the analytical table.
@Aggregation.default: #SUM
SalesVolume,

@Aggregation.default: #AVG
DifferenceAmount,

@Aggregation.default: #AVG
DifferenceQuantity,
Limitation
If we run our application, we currently receive an error, and if we look more closely at the service binding, we get an error message. Currently, functions related to virtual fields, such as the elements alone or the sorting of the elements, are not supported. Therefore, for demonstration purposes, we must comment out the various elements.
- The field definitions at the Projection View level (CDS ZBS_C_SASale)

- The virtual fields in the Metadata Extension (Metdata ZBS_C_SASale)

- The grouped fields in the Metadata Extension (Metdata ZBS_C_SASale)

Test
Let's look at different variations of the Analytical Table and how the features react to our data.
Total
After starting the application, no subtotals are defined yet. However, we can see that something has changed in the lower part of the table.

Since we are using different currencies in the column, the total is not displayed immediately. To see the total in this case, we need to click on the "Show Details" link. Click and you will then see a list of the different totals in the various currencies.

Subtotals
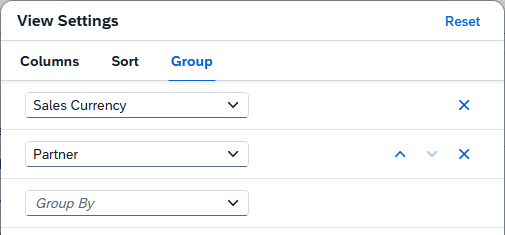
Using the table properties, we can now create subtotals via grouping. To do this, we switch to the "Group" tab and define a group "Currency" and a second group "Partner".
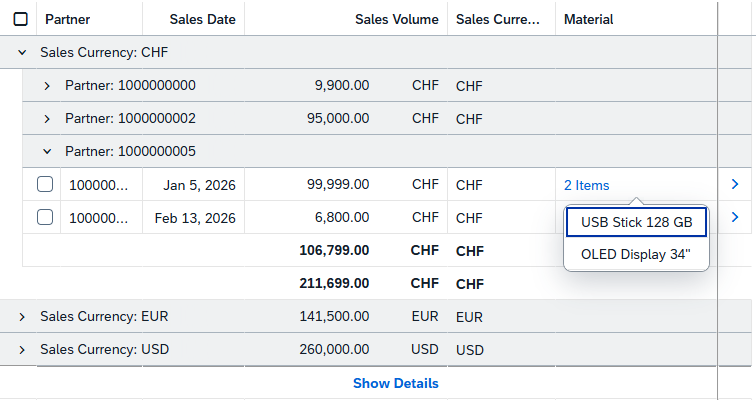
The table with totals and subtotals is now loaded. In the following example, we have also opened the elements to display the different levels. Since we only have one currency at a time, the subtotals are displayed directly, eliminating the need for a link.
If you want to define a grouping as the default, you can create and save a corresponding variant or add it directly as an annotation to the view. Further information can be found in this article.
Multi-Input Field
At the analytical table level, our Multi-Input Field currently has limited functionality. The column remains empty for now, and the feature is not active (only the total is displayed). If we then calculate subtotals and open the different rows, the number of items entered will be displayed, or if there is only one item. There are still some ambiguities in the display of the field in the column.
Complete Example
You can find the complete example in GitHub in the corresponding package for the Sales App. The changes from this article can be found in this commit, allowing you to understand the changes and the additional information.
Conclusion
The Analytical Table provides the final features for replacing the ALV; however, we currently need to choose between different features that our UI should have. Hopefully, this point will change again in the future, and we will gain more flexibility in using the different table types.
Source:
SAP Help - Developing Read-Only RAP Analytical Tables
ABAP Environment Roundtable #29