ABAP Tools - Work with Eclipse (Performance Analysis)
In this article we look at the performance analysis of objects using the ABAP development tools and the possibilities of traces.
Table of contents
So far, as a developer, Mal has primarily used classic transactions such as ST01, SAT or ST12 to check and, if necessary, optimize the performance of source code and connections. In this article we want to look at the possibilities of ABAP development tools and how you can use them efficiently for yourself.
Introduction
You always need the so-called traces if you suspect that the source code doesn't necessarily run very quickly or that the night isn't enough to process the data. But as a developer you should regularly check your own source code to see whether you have worked according to the relevant best practices. There are also a few things that should be taken into account when migrating from R/3 to S/4 HANA and, in addition to the ABAP Test Cockpit, or ATC for short, such traces can be incredibly helpful.
Preparation
So that you don't have to start off on a greenfield note, we have prepared three objects for you to work on. To do this, we create our own table in the system:
@EndUserText.label : 'Tabelle für Performance'
@AbapCatalog.tableCategory : #TRANSPARENT
define table zedu_performance {
  key client     : abap.clnt not null;
  key identifier : sysuuid_x16 not null;
  description    : abap.char(150);
  @Semantics.amount.currencyCode : 'zedu_performance.currency'
  amount         : abap.curr(15,2);
  currency       : abap.cuky;
  blob           : abap.string(0);
  ndate          : abap.dats;
}
The data later contains random data, different data types and information. HANA is optimized for storing the same and similar column contents, which is why we generate completely random-based information for the DESCRIPTION and BLOB fields. The class for initializing the data looks like this:
CLASS zcl_edu_performance_init DEFINITION PUBLIC FINAL CREATE PUBLIC.
  PUBLIC SECTION.
    INTERFACES if_oo_adt_classrun.

  PRIVATE SECTION.
    DATA mo_rand_amount   TYPE REF TO zcl_bs_demo_random.
    DATA mo_rand_currency TYPE REF TO zcl_bs_demo_random.
    DATA mo_rand_text     TYPE REF TO zcl_bs_demo_random.
    DATA mo_rand_blob     TYPE REF TO zcl_bs_demo_random.
    DATA mo_rand_date     TYPE REF TO zcl_bs_demo_random.
    DATA md_letters       TYPE string.

    METHODS get_random_currency
      RETURNING VALUE(rd_result) TYPE waers.

    METHODS get_description
      RETURNING VALUE(rd_result) TYPE zedu_performance-description.

    METHODS get_blob
      RETURNING VALUE(rd_result) TYPE zedu_performance-blob.

    METHODS get_letter
      RETURNING VALUE(rd_result) TYPE string.

    METHODS get_date
      RETURNING VALUE(rd_result) TYPE d.
ENDCLASS.


CLASS zcl_edu_performance_init IMPLEMENTATION.
  METHOD if_oo_adt_classrun~main.
    DATA lt_database TYPE STANDARD TABLE OF zedu_performance WITH EMPTY KEY.

    md_letters = to_lower( sy-abcde ) && to_upper( sy-abcde ).
    mo_rand_amount = NEW zcl_bs_demo_random( id_min = 10 id_max = 150 ).
    mo_rand_currency = NEW zcl_bs_demo_random( id_min = 1 id_max = 4 ).
    mo_rand_text = NEW zcl_bs_demo_random( id_min = 1 id_max = 52 ).
    mo_rand_blob = NEW zcl_bs_demo_random( id_min = 5000 id_max = 50000 ).
    mo_rand_date = NEW zcl_bs_demo_random( id_min = 0 id_max = 730 ).

    DELETE FROM zedu_performance.
    COMMIT WORK.

    " Create 50000 datasets
    DO 100 TIMES.
      DO 500 TIMES.
        INSERT VALUE #( identifier  = cl_system_uuid=>create_uuid_x16_static( )
                        description = get_description( )
                        amount      = mo_rand_amount->get_random_number( )
                        currency    = get_random_currency( )
                        blob        = get_blob( )
                        ndate       = get_date( ) )
               INTO TABLE lt_database.
      ENDDO.

      INSERT zedu_performance FROM TABLE @lt_database.
      COMMIT WORK.

      CLEAR lt_database.
    ENDDO.

    out->write( |Datasets for ZEDU_PERFORMANCE created!| ).
  ENDMETHOD.


  METHOD get_random_currency.
    CASE mo_rand_currency->get_random_number( ).
      WHEN 1.
        rd_result = 'EUR'.
      WHEN 2.
        rd_result = 'USD'.
      WHEN 3.
        rd_result = 'RUB'.
      WHEN 4.
        rd_result = 'CHF'.
    ENDCASE.
  ENDMETHOD.


  METHOD get_description.
    DO 150 TIMES.
      rd_result &&= get_letter( ).
    ENDDO.
  ENDMETHOD.


  METHOD get_blob.
    DO mo_rand_blob->get_random_number( ) TIMES.
      rd_result &&= get_letter( ).
    ENDDO.
  ENDMETHOD.


  METHOD get_letter.
    rd_result = substring( val = md_letters off = CONV i( mo_rand_text->get_random_number( ) - 1 ) len = 1 ).
  ENDMETHOD.


  METHOD get_date.
    rd_result = sy-datum - mo_rand_date->get_random_number( ).
  ENDMETHOD.
ENDCLASS.
Hint: The class will take some time to run because generating the random data and BLOBs requires a lot of performance. To generate the random numbers, we use our own random generator that uses the standard class from SAP.
Now we need the class that we want to optimize. To do this, we developed an example class that reads the data from the table, determines the relevant currencies and calculates the total for a period of time:
CLASS zcl_edu_performance_issue DEFINITION PUBLIC FINAL CREATE PUBLIC.
  PUBLIC SECTION.
    INTERFACES if_oo_adt_classrun.

  PRIVATE SECTION.
    TYPES ts_data TYPE zedu_performance.
    TYPES tt_data TYPE STANDARD TABLE OF zedu_performance WITH DEFAULT KEY.

    DATA mt_data TYPE tt_data.

    METHODS run_class_logic
      IMPORTING io_out TYPE REF TO if_oo_adt_classrun_out.

    METHODS select_data.

    METHODS get_relevant_currencies
      RETURNING VALUE(rt_result) TYPE tt_data.

    METHODS get_sum_for_currency_and_time
      IMPORTING id_currency      TYPE ts_data-currency
                id_from          TYPE ts_data-ndate
                id_to            TYPE ts_data-ndate
      RETURNING VALUE(rd_result) TYPE ts_data-amount.
ENDCLASS.


CLASS zcl_edu_performance_issue IMPLEMENTATION.
  METHOD if_oo_adt_classrun~main.
    GET RUN TIME FIELD DATA(ld_start).

    run_class_logic( out ).

    GET RUN TIME FIELD DATA(ld_end).
    out->write( |Runtime of code: { ld_end - ld_start }| ).
  ENDMETHOD.


  METHOD run_class_logic.
    select_data( ).

    DATA(lt_currencies) = get_relevant_currencies( ).

    LOOP AT lt_currencies INTO DATA(ls_currency).
      DATA(ld_amount) = get_sum_for_currency_and_time( id_currency = ls_currency-currency
                                                       id_from     = '20220101'
                                                       id_to       = '20220630' ).

      io_out->write( |Sum for currency { ls_currency-currency } is { ld_amount }.| ).
    ENDLOOP.
  ENDMETHOD.


  METHOD select_data.
    SELECT FROM zedu_performance
      FIELDS *
      INTO TABLE @mt_data.
  ENDMETHOD.


  METHOD get_relevant_currencies.
    rt_result = mt_data.
    SORT rt_result BY currency.
    DELETE ADJACENT DUPLICATES FROM rt_result COMPARING currency.
  ENDMETHOD.


  METHOD get_sum_for_currency_and_time.
    LOOP AT mt_data INTO DATA(ls_data)
         WHERE     currency  = id_currency
               AND ndate    >= id_from
               AND ndate    <= id_to.

      rd_result += ls_data-amount.
    ENDLOOP.
  ENDMETHOD.
ENDCLASS.
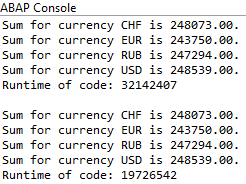
If we now run the class, we get the result once for the cold start (no database buffer available) and in the second run with the database buffer. After all, the class takes 19 seconds to execute, which is too long on an S/4 HANA system.
ABAP Profiling
To carry out a trace, we recommend using your own perspective, the "ABAP Profiling" perspective, which you can select and open via "Window -> Perspective -> Open Perspective -> Others...". In the simplest case, you use the button at the top right next to the other perspectives. You can see what such a perspective can look like in the picture here.
In the upper area you will find the object and later the evaluation, on the right the properties and at the bottom the two views "ABAP Trace Requests" and "ABAP Traces", which we need for further work.
ABAP Trace Requests
The view shows all open systems that you have access to. Under the systems you will find the various traces that have been carried out in the past, adjusted accordingly to the current user. You can adjust this setting at any time to find your colleagues' traces.
In this view you create your trace requests on the system and thus activate the trace. To do this, simply right-click on the desired system and select the entry "Create Trace Request..." from the context menu.
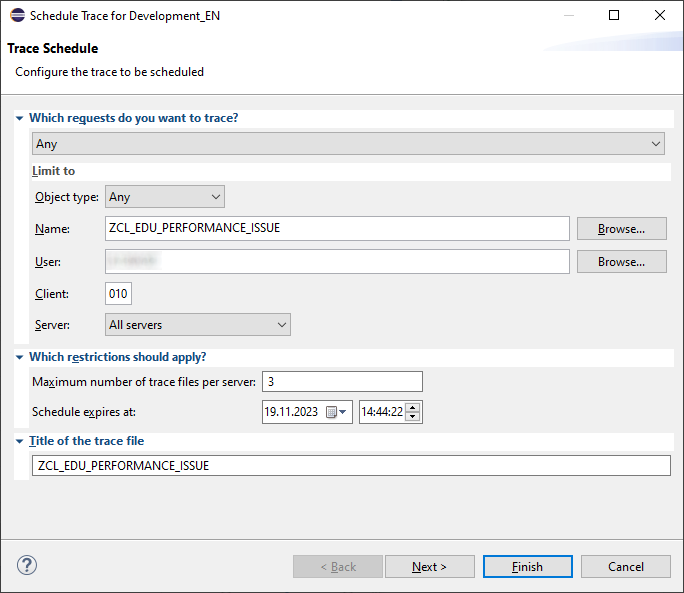
In the next picture you can configure your trace; different methods are available here, depending on what you want to examine in more detail. To keep it simple, we set it to "Any" and limit it to our class and our user. The number, here set to three, means how many traces the system carries out before the trace request is deactivated.
In addition to Any, the following are also available: Web Requests (HTTP), Reports and Transactions (Dialog), Remote function call (RFC), Background Jobs (Batch) and Shared Objects Area. With "Next" we go to the next image where we can make further settings and restrictions, for example to keep the size of the log small.
With "Finish" the trace is ready and we run the console application once to carry out our first trace.
ABAP Traces
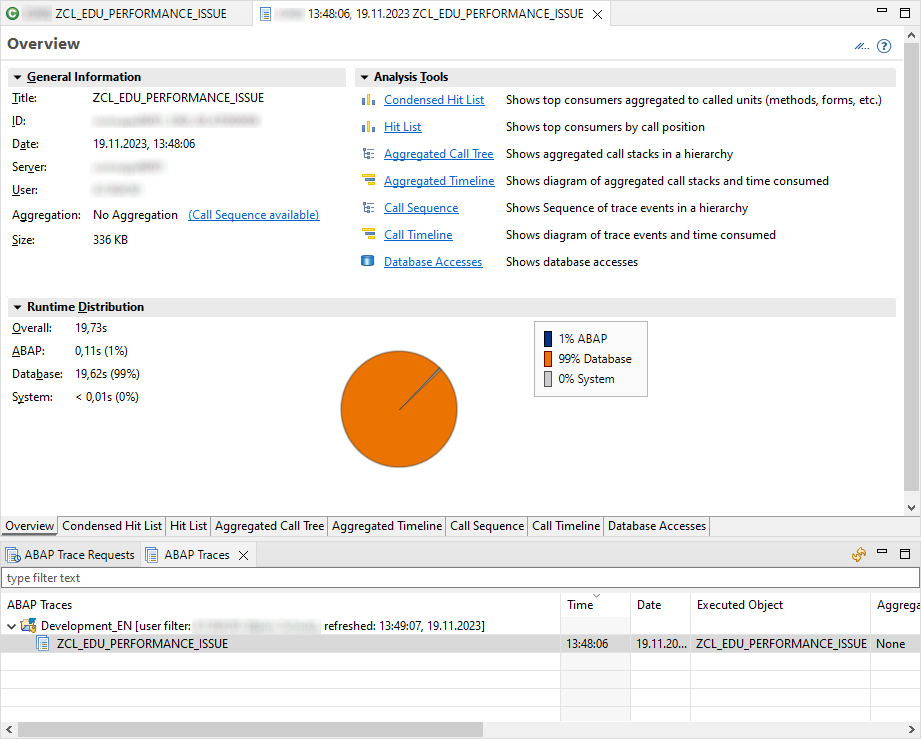
After executing, update the system in the “ABAP Traces” view and our first trace should appear. By double-clicking on it, the overview of the trace is displayed next to the source code.
In addition to the general overview, we can find further insights into the trace in the tabs below or under “Analysis Tools” above. For our example, let’s look at two different views.
Call Sequence
The calls to the routines are displayed hierarchically here, with the corresponding runtimes behind them. Here you can follow the call of the coding and identify places where a lot of time is lost.
Call Timeline
The view digitizes the result as a timeline and clearly shows where a lot of time is being used. In the lower part you get an overview of the different colors. If you move the mouse over the bar, information about the statement will also be displayed.
Hit List
Actually the first view you should look at. If you sort by the “Own Time” column, you will get a look at the long runners and performance guzzlers and can directly optimize the appropriate methods and statements.
Properties
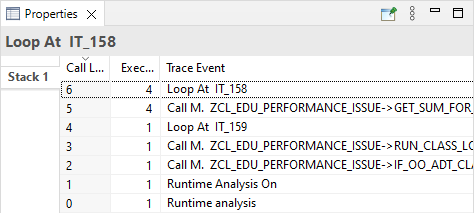
Maybe you've already asked yourself why we recommend the "Properties" view for viewing? Whenever you select an entry, various information is displayed. For example, when you click in the “Hit List”:
Solution
In the following section you will receive the optimization of the source code, first as code and then in text form. If you want to carry out the trace in peace, simply pause this section and carry out your analyzes and optimizations.
CLASS zcl_edu_performance_fixed DEFINITION PUBLIC FINAL CREATE PUBLIC.
  PUBLIC SECTION.
    INTERFACES if_oo_adt_classrun.

  PRIVATE SECTION.
    TYPES ts_data TYPE zedu_performance.
    TYPES tt_data TYPE STANDARD TABLE OF zedu_performance WITH DEFAULT KEY.

    DATA mt_data TYPE tt_data.

    METHODS run_class_logic
      IMPORTING io_out TYPE REF TO if_oo_adt_classrun_out.

    METHODS get_relevant_currencies
      RETURNING VALUE(rt_result) TYPE tt_data.

    METHODS get_sum_for_currency_and_time
      IMPORTING id_currency      TYPE ts_data-currency
                id_from          TYPE ts_data-ndate
                id_to            TYPE ts_data-ndate
      RETURNING VALUE(rd_result) TYPE ts_data-amount.
ENDCLASS.


CLASS zcl_edu_performance_fixed IMPLEMENTATION.
  METHOD if_oo_adt_classrun~main.
    GET RUN TIME FIELD DATA(ld_start).

    run_class_logic( out ).

    GET RUN TIME FIELD DATA(ld_end).
    out->write( |Runtime of code: { ld_end - ld_start }| ).
  ENDMETHOD.


  METHOD run_class_logic.
    DATA(lt_currencies) = get_relevant_currencies( ).

    LOOP AT lt_currencies INTO DATA(ls_currency).
      DATA(ld_amount) = get_sum_for_currency_and_time( id_currency = ls_currency-currency
                                                       id_from     = '20220101'
                                                       id_to       = '20220630' ).

      io_out->write( |Sum for currency { ls_currency-currency } is { ld_amount }.| ).
    ENDLOOP.
  ENDMETHOD.


  METHOD get_relevant_currencies.
    SELECT FROM zedu_performance
      FIELDS DISTINCT currency
      INTO CORRESPONDING FIELDS OF TABLE @rt_result.
  ENDMETHOD.


  METHOD get_sum_for_currency_and_time.
    SELECT FROM zedu_performance
      FIELDS SUM( amount ) AS amount
      WHERE     currency  = @id_currency
               AND ndate    >= @id_from
               AND ndate    <= @id_to
      INTO @rd_result.
  ENDMETHOD.
ENDCLASS.
So what changes have we actually made? Here is the complete solution again:
- Restriction of fields in SELECT - A SELECT * can lead to performance problems on an S/4 HANA system, especially if you do not need all fields or even contain BLOB objects at row level.
- Splitting the SELECT - On an R/3 system it made perfect sense to first read in all the data and then carry out the processing in the source code. Here we save ourselves the logic and let the database work for us (reading the existing currencies, determining the total per period)
After the SELECT * has been resolved, the runtime improves to around 200 milliseconds without a buffer.
SELECT FROM zedu_performance
  FIELDS identifier, amount, currency, ndate
  INTO CORRESPONDING FIELDS OF TABLE @mt_data.
Add to that the new "Call Timeline" from a second trace, database access only takes almost half the time. Furthermore, the processing in the loop can be seen very clearly. In the result above, we have once again optimized reading across multiple accesses:
Conclusion
The trace tools are clear and easy to use and offer extensive evaluation options. It is always worth taking a look at the different evaluation methods and comparing different traces with each other.

