ABAP Tools - Work with Eclipse (Feed Reader)
In this article we look at the analysis capabilities in the ADTs and how to find dumps and other information from the system.
Table of contents
An important part of the development work is the analysis of the dumps, the communication log and other transactions in the system when errors have occurred. You always have to actively look at the transactions to get information. In this article, you will learn more about the various options provided by the ABAP development tools.
Introduction
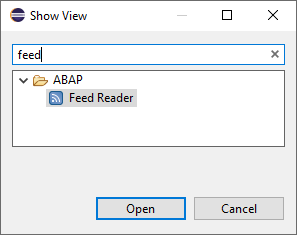
There are no more transactions in Eclipse, so how do you get all the information you need to develop? There is also the "Feed Reader" view, which is provided by Eclipse and can be configured by you as you need it. You can find the Feed Reader via the corresponding icon under the tools.
If the view is not available, you can display it via the menu under "Window -> Show View -> Other ...". There you have to select it from the list or use the search field to limit the number of hits.
View
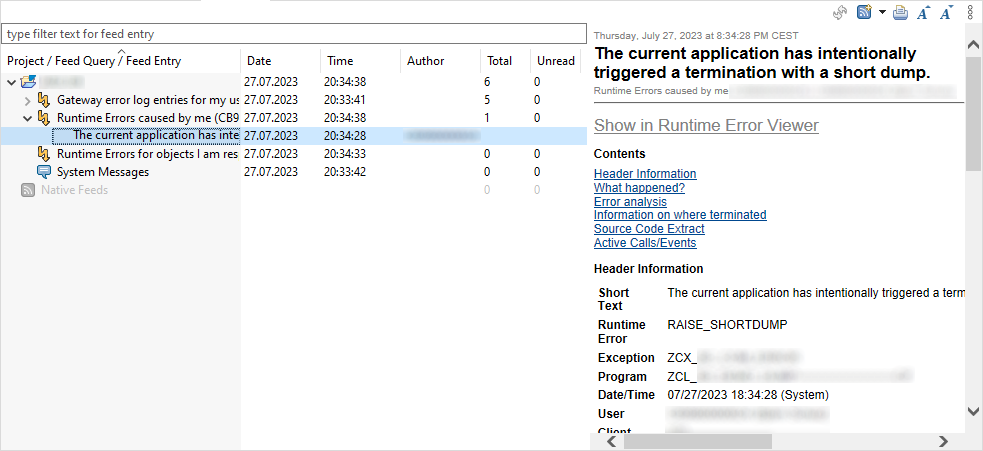
How is the view actually structured? Let's take a closer look at this, this is an example with an active system. Basically you will find all active systems in the list here.
The structure now looks like this:
- Left Side - All embedded and open systems. After expanding a system, all configured feeds are displayed. A feed describes a type of message in the system. In the columns you will find more information about the update, the user and the number of reports.
- Right side - Detailed information on the selected feed or the message, if you have selected one in detail.
- Toolbar - Here you will find further actions, such as updating or embedding a new feed.
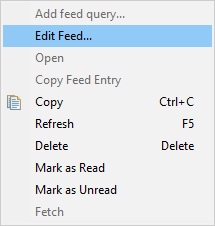
Using the context menu, you can right-click on the system to create a new feed and make settings on the feed itself to customize the information you see in the feed and that is selected.
Availability
Which feeds are available in the ABAP development tools depends on the backend system for which you are creating the feed. The release determines the features offered and which feeds you can subscribe to. Let's take a look at the feeds of the ABAP Environment, which is always on the latest release:
To this end, we are now contrasting an R/3 system on the latest SP, which is still available for R/3. The number of available feeds has already decreased:
Hint: The ABAP runtime errors and the gateway log are particularly important for development and analysis.
Configuration
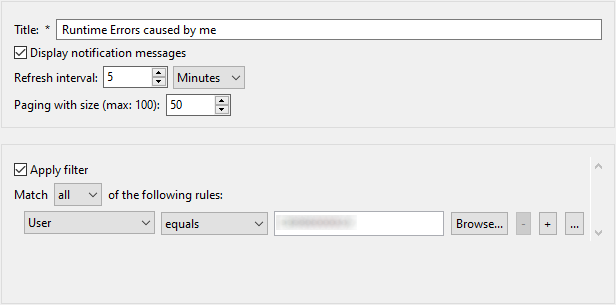
You can adjust the feed accordingly via the context menu. Let’s take a look at the options for runtime errors:
In addition to the title in the upper part, we can also define whether we want notifications when new errors are generated and every how many minutes Eclipse should look for new crashes on the backend system. You can also specify how many dumps should be displayed at once. Filters can then be applied in the lower area if, for example, you are only interested in your own errors or errors from certain packages, components, etc. With these settings you can further restrict the messages received and tailor them to you.
Push Notifications
In the next step, let's create a dump in the system and see how the feed reader behaves, using the settings shown in the previous section. There are various ways of creating a dump in the system. Simplest example would probably just divide by zero and not catch the exception. However, we throw an exception in an executable class and do not handle it:
CLASS zcl_bs_demo_dump DEFINITION
  PUBLIC
  FINAL
  CREATE PUBLIC.

  PUBLIC SECTION.
    INTERFACES if_oo_adt_classrun.
ENDCLASS.

CLASS zcl_bs_demo_dump IMPLEMENTATION.
  METHOD if_oo_adt_classrun~main.
    RAISE SHORTDUMP NEW zcx_test_error( textid = zcx_test_error=>cs_err_type ).
  ENDMETHOD.
ENDCLASS.
A dump is generated in the system when it is executed and logged accordingly in the ST22. As soon as the update is carried out in Eclipse, you will receive a corresponding popup in the lower right part of the application:
You can now see the termination in the feed reader and you can view the prepared information by clicking on the entry in the feed:
In the upper area of the detailed view you will find the "Show in Runtime Error Viewer" link, which you can use to open the error again in a separate view and analyze the details.
Conclusion
The Feed Reader offers you various options for accessing the known logs in the backend, evaluating them and adapting the views to you again. You also get the information as a push notification and do not have to actively check the system, a clear advantage over the SAP GUI.


