ABAP Tools - Working with Eclipse (Multiple Debugging Sessions)
How are multiple debugging sessions managed in the ABAP Development Tools in Eclipse? More information here.

Table of contents
In an older article about setting locks, we briefly discussed working with multiple debugging sessions for a piece of source code. In this short article, we'll take a look at the details.
Introduction
In the SAP GUI, you previously had the choice between the same session or a new session when it came to the debugger. The classic debugger was loaded in the same session and the new debugger, which is prettier and offers more functions, was loaded in an additional session. In Eclipse, depending on the setting, the debugging perspective starts and shows you the appropriate tools to start debugging.
Preparation
So that we can look at the debugger in the next step, we need source code that we can also debug. To do this, we create a small executable class in the system.
CLASS zcl_bs_demo_debug DEFINITION
  PUBLIC FINAL
  CREATE PUBLIC.

  PUBLIC SECTION.
    INTERFACES if_oo_adt_classrun.
ENDCLASS.


CLASS zcl_bs_demo_debug IMPLEMENTATION.
  METHOD if_oo_adt_classrun~main.
    DATA(ld_first) = 5.
    DATA(ld_second) = 7.

    DATA(ld_result) = ld_first + ld_second.

    IF ld_result > 10.
      out->write( |The result is: { ld_result }| ).
    ENDIF.
  ENDMETHOD.
ENDCLASS.
Perspective
In the upper right part of Eclipse you will find various perspectives that you have already used in the past. In this example you will find various perspectives that can be used for different purposes.

A perspective arranges different views on the screen and stores the information in the perspective. Therefore, you do not necessarily need multiple perspectives to work, but it is recommended because you need different views for different situations.
Debugging
Before we can debug, we have to set a breakpoint in the coding. There are two ways to do this, once via the context menu and once by double-clicking. In the image, both variants are shown and executed.

We can now start the executable class with F9. If the breakpoint is set, the system switches to the debugger perspective or at least asks if you want to switch to this perspective. We recommend using your own perspective. After switching, we get the following perspective.

Hint: You can freely design the perspective settings for yourself. We have configured the view similarly to the new debugger in the SAP GUI, as this makes switching easier.
Sessions
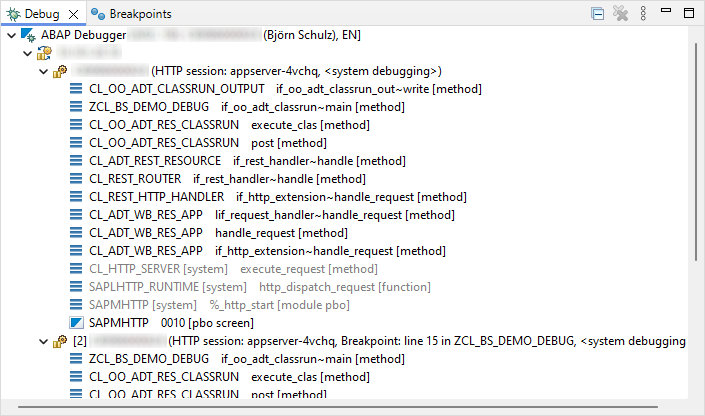
In this article, we will focus primarily on the "Debug" view, as this is where the so-called callstack can be found. Similar to the SAP GUI, we see the call stack up to the current point in time. At the same time, we can double-click on another location and look at the variables and the source code around them, or set a breakpoint if we want to debug further up.

We can also see from the stack that we are currently in an executable class and that this was started in the system by the ADT endpoint. In the next step, we debug a few steps further into the output method and start the class again using F9, thereby creating a second debugging session in the system. In the view you can now see two sessions under our user.
In the next demo we jump back and forth between the two debugging sessions and also once in the stack. Working with multiple sessions can be easily done via the view.
End session
How do we end the sessions when we have finished debugging and what effect does this have on the following process? In the "Debug" view you can Right-click on the individual session and you will receive further options via the context menu.

The following options are available to you:
- Resume - This is the classic F8 in the debugger, lets the session continue running until the end or until another breakpoint is reached.
- Terminate - The debugging session and the program flow are aborted. This means that the rest of the coding is no longer executed.
- Disconnect - The debugging session is terminated, the program flow continues. This allows you to end your session and the logic will continue as normal.
Summary
Here is a short summary of the most important points about working with multiple sessions:
- You can find the various open sessions in the "Debug" view; you don't necessarily have to be in the debug perspective to do this.
- The session always shows the complete call stack so that you can navigate between the different levels.
- You can keep many open debugging sessions and don't have to worry about running out of modes when debugging remotely.
- With Terminate and Disconnect, you have two functions at your disposal to bring your debugging session to an end.
Conclusion
Working with different debugging sessions is as easy as in the SAP GUI, but the sessions are more easily summarized in one window and do not have to be searched for via different SAP GUI modes.